Designing an addiction assessment and treatment platform
Client - Neurotype
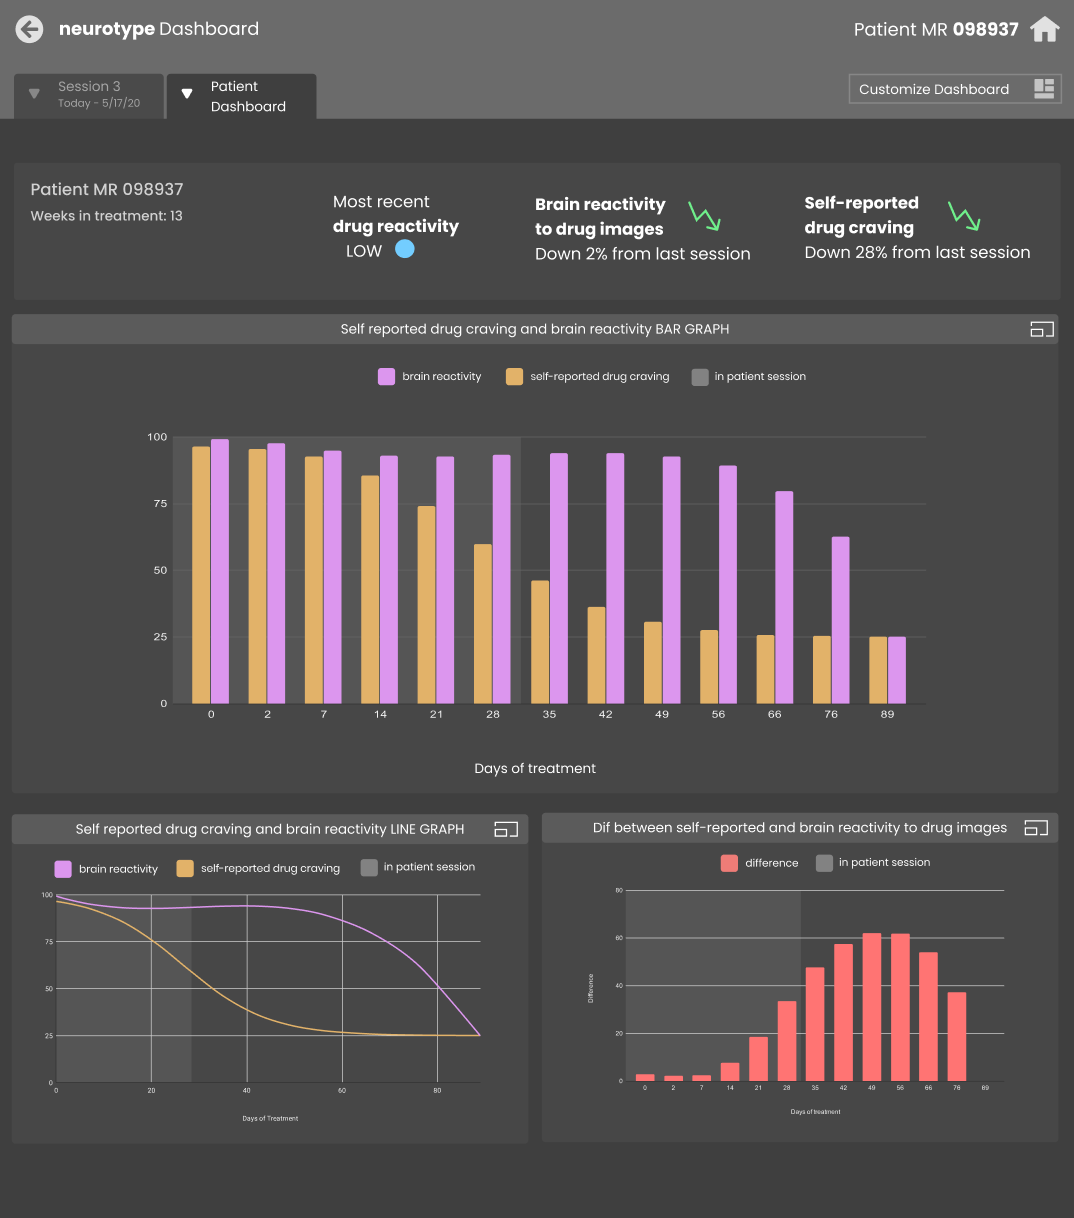
Neurotype is working to develop a platform that integrates the use of portable electroencephalogram (EEG) headset into Opioid Use Disorder (OUD) treatment and therapy clinics. This platform, NeuromarkR™, would allow practitioners without specialized training in EEG to incorporate this quantitative metric into their treatment and evaluation process. We were tasked with creating an intuitive, tablet-based experience flow for both the patient and practitioner to use during patient progress assessments as well as a data-visualization dashboard for patient assessment results.
My role
UX Research - Moderated both an initial discovery user interview as well as usability tests with our high-fidelity prototype.
UX Design - User flow and wireframes
UI Design - Co-created the final UI, design system and interactive prototype in Figma.
Deliverables
Interactive prototype*
UI*
Design Style Guide
User flow*
* Played a primary role
Tools
Figma - Design and Prototyping*
Miro - Collaboration
Notion - Project management*
Methodologies
Secondary research
User interviews*
Usability testing*
Information architecture*
Experience mapping*
Interactive prototyping*
Project Overview
The Challenge:
Create an experience that is easily interpretable and learnable by EEG non-experts and approachable to Opioid Use Disorder (OUD) patients.
High-level Goals:
Transition the traditionally lab-based EEG assessment to be used in a clinical setting
Make data understandable to a non-technical audience through effective UX and visual design
Use data to impact and substantiate treatment
Research + Discovery
Stakeholder interview
We began the project with an initial meeting with our client, Dr. Scott Burwell, to talk to him about why he founded Neurotype and what he was looking for in the digital experience.
Secondary research
With a solid understanding of our client’s goals for the product, we then conducted a competitor audit to get a feel for what products were already on the market, what they were doing well, and how Neurotype could differentiate itself in that space.
Both our client and one of the primary user groups (health practitioners) work in a research-driven field. With that in mind, we dug into some academic resources on the following subjects:
- Integrating technology into the mental health field -
- The use of EEG devices to measure cravings -
- Comparing EEG brainwave data to self-reported cravings -
Define
We then began to create a visual structure of the experience to help us identify where the pain points and opportunity spaces of the user were.
This helped us to conceptualize an overall experience early on that we could refer back to and improve upon throughout the project.
User Interviews
With a solid understanding of the space, we began conducting remote discovery interviews with practitioners in addiction therapy and parallel fields.
This helped us gain a feeling for the context of practitioners working in a variety of settings, and gauge their initial reactions to the product concept.
High-level findings:
Practitioner’s needs were very intertwined with patient needs/comfort.
Practitioners made no assumptions that brain reactivity was an important metric to track. They needed to see the research to substantiate value before endorsing the idea or considering bringing it into their own practice.
A NeuromarkR session would need to be under 15 minutes in order for practitioners to realistically integrate the tool into their treatment.
I find the discovery phase to be an extremely important phase of the overall process. This is when you must challenge all your assumptions of the space you are entering into, and if you dont come at it with that perspective you risk losing some of the most valuable insights.
“Testing should be for the sake of the client’s growth. And they should be involved in what that journey looks like…to make sure that what is being created serves the client at the end of the day”
Synthesizing our research findings
Remote group synthesis was done on a Miro board where we organized data gathered in user interviews and began to organize concrete findings that were incorporated into our next design iteration and tested for in our remote usability tests.
Architecting the experience
From what we gathered during our stakeholder interviews and user interviews, I created a user flow that illustrated the experience at a high-level, noting the device handoff interactions between the patient and practitioner.
Wireframes
I created wireframes for the log-in, dashboard, check-in and EEG assessment experience:
UI Design
From there, we created an initial round of designs and packaged it into a clickable Figma prototype for both client review and later, usability testing
We created a color-coded system that assigned purple for the patient and turquoise for the clinitian to add helpful visual cues for the device handoff during the session.
A dark-mode background was used for the experience as a whole as it had a more calming effect for the patient taking the assessment and also helped the data visualization colors stand out more on the data dashboard.


Usability Testing
We used the clickable Figma prototype to conduct usability testing with practitioners to get feedback on the experience we had created so far.
What we heard…
Customization
OUD patients can be triggered by very different images depending on the person. Practitioners therefore wanted to be able to customize the session to each individual patient, particularly the images being shown and the questions being asked.
Understandable data
When first hearing about NeuromarkR, practitioners seemed skeptical about their ability to interpret the data in a way that would be meaningful for their practice. For that reason, making data visuals approachable and easily digestible was essential.
Options for data visualization
Practitioners expressed to us that they would be interested in seeing different types of information for each of their patients. We therefore made sure to include different data visualizations that could be selected for in each patient’s personal settings.


